12012010 Python matplotlib
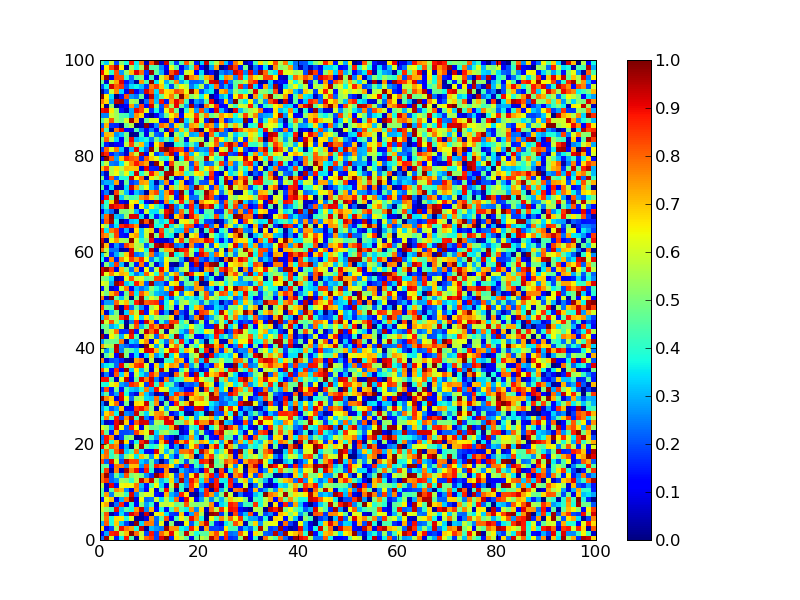
ちょっと描きたいものがあったので調べたらpcolormeshを使えばいいだけだった。
from numpy import *
from pylab import *
a = rand(100,100)
pcolormesh(a)
colorbar()
savefig('colour.png')

12012010 Python matplotlib
ちょっと描きたいものがあったので調べたらpcolormeshを使えばいいだけだった。
from numpy import *
from pylab import *
a = rand(100,100)
pcolormesh(a)
colorbar()
savefig('colour.png')

12012010 bioinformatics Python
12012010 Python
X-meansの論文を眺めていたら、最初から2-meansやってBICが大きくなる限り再帰的に2-meansやればいいんじゃないの?と思ったので、そういう風なものを書いてみたという。
K-meansのコードは「集合知プログラミング」のものを参考にした。データも集合知プログラミングのブログのデータを使ってます
コードは分散のとことか、結局クラスのデータが一つ二つになっちゃった場合とかのエラーに対応すんのがめんどくなって適当にいじってるのでかなりいい加減というかいい加減すぎなのでダメすぎなので、そういうかんじで。BICもきちんと理解しないといけないのだけど、とりあえずやっつけ的になってしまった。
import random
from math import sqrt,pi,log

def pearson(v1,v2):
    sum1=sum(v1)
    sum2=sum(v2)

    sum1Sq=sum([pow(v,2) for v in v1])
    sum2Sq=sum([pow(v,2) for v in v2])

    pSum=sum([v1[i]*v2[i] for i in range(len(v1))])

    num=pSum-(sum1*sum2/len(v1))
    den=sqrt((sum1Sq-pow(sum1,2)/len(v1))*(sum2Sq-pow(sum2,2)/len(v1)))
    if den==0: return 0

    return 1.0-num/den

def euclid(v1,v2) :
    return sqrt(sum([pow(v1[i]-v2[i],2) for i in range(len(v1))]))

def kcluster(rows,cluster,distance=euclid,k=2):
    ranges=[(min([rows[c][i] for c in cluster]),max([rows[c][i] for c in cluster]))
            for i in range(len(rows[0]))]

    clusters=[[random.random()*(ranges[i][1]-ranges[i][0])+ranges[i][0]
               for i in range(len(rows[0]))] for j in range(k)]

    lastmatches = None
    for t in range(100):
        bestmatches=[[] for i in range(k)]

        for j in cluster:
            row = rows[j]
            bestmatch = 0
            for i in range(k):
                d = distance(clusters[i],row)
                if d < distance(clusters[bestmatch],row): bestmatch=i
            bestmatches[bestmatch].append(j)

        if bestmatches == lastmatches: break
        lastmatches = bestmatches

        for i in range(k):
            avgs=[0.0]*len(rows[0])
            if len(bestmatches[i])>0:
                for rowid in bestmatches[i]:
                    for m in range(len(rows[rowid])):
                        avgs[m]+=rows[rowid][m]
                for j in range(len(avgs)):
                    avgs[j]/=len(bestmatches[i])
                clusters[i]=avgs

    return bestmatches,clusters

def readfile(filename):
    lines=[line for line in file(filename)]

    colnames=lines[0].strip().split('\t')[1:]
    rownames=[]
    data=[]
    for line in lines[1:]:
        p=line.strip().split('\t')
        rownames.append(p[0])
        data.append([float(x) for x in p[1:]])
    return rownames,colnames,data

def likelihood(data,cluster,avg_cluster,k):
    sample_number = len(cluster)
    variance = sum([pow(data[c][i] - avg_cluster[i],2) for i in range(len(avg_cluster)) for c in cluster]) / float(sample_number)
    if variance == 0: variance = 0.0000000000000001
    lkh = -sample_number/2*log(2*pi) - sample_number*len(avg_cluster)/2*log(variance) - (sample_number - k)/2 + sample_number*log(sample_number)
    return lkh

def _xcluster(data,cluster,bic,k):

    bm,cl = kcluster(data,cluster)
    if len(bm[0]) == 0 or len(bm[1]) == 0:
            bm,cl = kcluster(data,cluster)

    new_likelihood = likelihood(data,bm[0],cl[0],2) + likelihood(data,bm[1],cl[1],2)
    new_bic = new_likelihood - (2*len(data[0])+1)/2 * log(len(cluster))
    if bic < new_bic:
        if len(bm[0]) > 1:
            bicl =  likelihood(data,bm[0],cl[0],1) - (len(data[0])+1)*log(len(bm[0]))/2
            nl = _xcluster(data,bm[0],bicl,2)
        else:
            nl = bm[0]
        if len(bm[1]) > 1:
            bicr =  likelihood(data,bm[1],cl[1],1) - (len(data[0])+1)*log(len(bm[1]))/2
            nr = _xcluster(data,bm[1],bicr,2)
        else:
            nr = bm[1]
        return [nl,nr]
    else:
        return cluster

def xcluster(filename,distance=euclid,k=2):
    rownames,colnames,data = readfile(filename)
    sample_number = len(data)
    params        = len(data[0])
    avg =  [sum([data[j][i] for j in range(sample_number)])/float(sample_number) for i in range(params)]
    bic =  likelihood(data,range(len(data)),avg,1) - (params+1)*log(sample_number)/2
    bestclusters = _xcluster(data,range(sample_number),bic,2)
    return bestclusters
コードはいろんな部分がダメすぎてあれなんだけど、とりあえず実行。
>>> from xmeans import *
>>> xcluster("blogdata.txt")
[[[[[[[0, 2, 3, 5, 7, 8, 11, 12, 13, 15, 16, 17, 20, 21, 22, 26, 28, 29,
30, 32, 34, 36, 38, 39, 40, 43, 47, 48, 50, 51, 52, 53, 54, 55, 56, 57, 58,
59, 60, 63, 64, 65, 66, 67, 68, 69, 70, 71, 72, 74, 75, 76, 77, 78, 79, 80,
83, 84, 86, 87, 88, 89, 92, 95, 96, 97], [44]], [[91], [37]]], [1, 6, 9,
10, 14, 18, 19, 27, 31, 33, 35, 45, 61, 73, 82, 90, 93, 98]], [[85], [[23],
[[25], [[[49], [94]], [62]]]]]], [[4], [[81], [[42], [[41], [46]]]]]], [24]]
あとで、もうちょっと考える。
12012010 chemoinformatics Python
12012010 Python
pythonの組み込みウェブサーバーは便利で
import SimpleHTTPServer
SimpleHTTPServer.test()
という打鍵をpythonのインタラクティブシェルを起動してやっているのだけどPython - Swiss Army Knife Web Serverのコメントにあるような、
python -m SimpleHTTPServer
なんてできることを初めて知った。ということで、次の一行を.bashrcに書いておけば
alias pyhttpd='python -m SimpleHTTPServer'
いつでもpython組み込みのサーバーが起動して快適だ。例えば、画像突っ込んだディレクトリの内容なんかはさくっと見れていい感じ。
-mで呼び出すとモジュールの__main__が呼ばれるのね。モジュールの中身をみたら
if __name__ == '__main__':
    test()
って書いてあった。なるほど。(デーモンじゃないけど分かりやすいのでpyhttpdってコマンドで使うことにした。)
12012010 Python matplotlib
matplotlibがメインなのかな?目次だけだとよくわからん。
 Beginning Python Visualization: Crafting Visual Transformation Scripts (Books for Professionals by Professionals)
ビジュアライジング・データ読んどけば良い気もするが。
おもむろにllvmをインストール。
sudo port install llvm
でok。llvm-pyはサイトからダウンロードしてきていれた。
で、サンプルをやってみる。
#!/usr/bin/env python

from llvm import *
from llvm.core import *
from llvm.ee import *

my_module = Module.new('my_module')
ty_int = Type.int()   # by default 32 bits
ty_func = Type.function(ty_int, [ty_int, ty_int])
f_sum = my_module.add_function(ty_func, "sum")
f_sum.args[0].name = "a"
f_sum.args[1].name = "b"
bb = f_sum.append_basic_block("entry")
builder = Builder.new(bb)
tmp = builder.add(f_sum.args[0], f_sum.args[1], "tmp")
builder.ret(tmp)

mp = ModuleProvider.new(my_module)

ee = ExecutionEngine.new(mp)

arg1 = GenericValue.int(ty_int, 100)
arg2 = GenericValue.int(ty_int, 42)

print my_module
retval = ee.run_function(f_sum, [arg1, arg2])

print "returned", retval.as_int()
実行結果
; ModuleID = 'my_module'

define i32 @sum(i32 %a, i32 %b) {
entry:
    %tmp = add i32 %a, %b       ; <i32> [#uses=1]
    ret i32 %tmp
}

returned 142
12012010 chemoinformatics perl bioinformatics Python
バイオインフォだけだと片手落ちの気がする。表紙はケクレ構造にちなんで亀でお願いしたい。
今のCPUとかmemoryの状況でLLで量子化学とか、かなりアリだと思うんだけどなぁ。pyquanteとかやばいでしょう。
ヒューリスティクスは割と好きだ。スパッととけないものをなんとか現実と折り合いを付けながらよりよい解を見つけるみたいな、なんとも煮え切らない美しさのなさがたまらん。インフォマティクスも似たような香りはする。
特に、「シミュレーションできない学問は学問として未成熟である」という言葉に従うのであれば、創薬研究は(学際領域)と言われている割には未成熟な学問の組み合わせのために発見的な手法の割合が増えすぎるし、精度の高い予測法の誕生もまだまだ先であろう。というわけで、発見的な探索手法は当分有用だし、学際領域故に融合部分での応用が期待されるため、アルゴリズムとしてきちんと押さえておくと色々役に立つ。
メタヒューリスティクスの数理の4章はpythonのコードが載っているので、勉強になる。
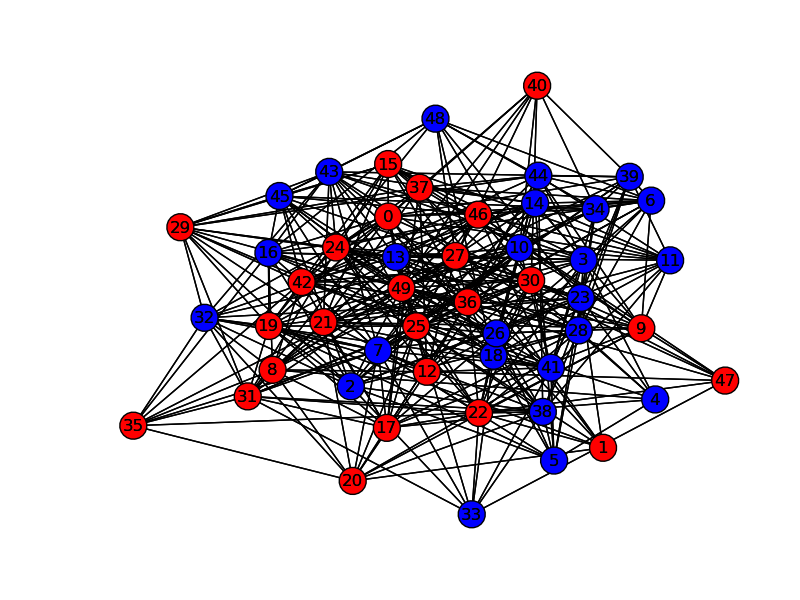
4.1のグラフ分割問題をnetworkxで可視化するように書き換えた。

import math,random
from sys import maxint as Infinity

def rnd_graph_fast(nnodes, prob):
    nodes = range(nnodes)
    adj = [[] for i in nodes]
    i=1;j=1
    logp = math.log(1.0 - prob)
    while i<nnodes:
        logr = math.log(1.0 - random.random())
        j += 1+int(logr/logp)
        while j>=i and i<nnodes:
            j -= i
            i += 1
        if i<nnodes:
            adj[i].append(j)
            adj[j].append(i)
    return nodes, adj

def construct(nodes):
    sol = [0 for i in nodes]
    for i in range(len(nodes)/2):
        sol[i] = 1
    return sol

def evaluate(nodes, adj, sol):
    cost = 0
    s = [0 for i in nodes]
    d = [0 for i in nodes]
    for i in nodes:
        for j in adj[i]:
            if sol[i] == sol[j]:
                s[i] += 1
            else:
                d[i] += 1
    for i in nodes:
        cost += d[i]
    return cost/2, s, d\

def find_move(part, nodes, adj, sol, s, d, tabu, tabulen, iteration):
    mindelta = Infinity
    istar  = None
    for i in nodes:
        if sol[i] != part:
            if tabu[i] <= iteration:
                delta = s[i] - d[i]
                if delta < mindelta:
                    mindelta = delta
                    istar = i
    if istar != None:
        return istar, mindelta
    tabu = [0 for i in nodes]
    return find_move(part, nodes , adj, sol, s, d, tabu, tabulen, iteration)

def move(part, nodes, adj, sol, s, d, tabu, tabulen, iteration):
    i, delta = find_move(part, nodes, adj, sol, s, d, tabu, tabulen, iteration)
    sol[i] = part
    tabu[i] = iteration + tabulen
    s[i], d[i] = d[i], s[i]
    for j in adj[i]:
        if sol[j] != part:
            s[j] -= 1
            d[j] += 1
        else:
            s[j] += 1
            d[j] -= 1
    return delta

def tabu_search(nodes, adj, sol, max_iter, tabulen):
    cost, s, d = evaluate(nodes, adj, sol)
    tabu = [0 for i in nodes]
    bestcost = Infinity
    for it in range(max_iter):
        cost += move(1, nodes, adj, sol, s, d, tabu, tabulen, it)
        cost += move(0, nodes, adj, sol, s, d, tabu, tabulen, it)
        if cost < bestcost:
            bestcost = cost
            bestsol = list(sol)
    return bestsol, bestcost


if __name__ == "__main__":
    import networkx as nx
    import matplotlib.pyplot as plt
    num_nodes = 50
    nodes, adj = rnd_graph_fast(num_nodes,0.3)
    G=nx.Graph()
    for i in range(num_nodes):
        G.add_node(i)
    for i in range(num_nodes-1):
        for j in adj[i]:
            if i < j:
                G.add_edge(i,j)
    pos=nx.spring_layout(G)

    max_iter = 1000
    tabulen = 10
    sol = construct(nodes)
    sol, cost = tabu_search(nodes, adj, sol, max_iter, tabulen)

    rnodelist = []
    bnodelist = []
    for i in range(len(sol)):
        if sol[i] == 1:
            rnodelist.append(i)
        else:
            bnodelist.append(i)
    nx.draw(G,pos,nodelist=rnodelist,node_color='r')
    nx.draw(G,pos,nodelist=bnodelist,node_color='b')
    plt.savefig("path.png")
これをちょっと変えてSimulated Annealingにできる。
12012010 Python
エッジをネガティブな力とした時に、エッジを構成しないノードの最大集合を求める問題を最大安定集合問題といい、これは補グラフの最大クリーク問題と同値である。
networkx用のコード
if __name__ == "__main__":
    import networkx as nx
    import matplotlib.pyplot as plt

    num_nodes = 100
    nodes,edges = rnd_graph(num_nodes,0.5)
    cedges = complement(nodes,edges)
    adj = adjacent(nodes, cedges)
    max_iterations = 1000
    tabulength = len(nodes)/10

    G=nx.Graph()
    for i in range(num_nodes):
        G.add_node(i)
    for i in range(num_nodes-1):
        for j in adj[i]:
            if i < j:
                G.add_edge(i,j)

    pos=nx.spring_layout(G)
    sol = construct(nodes,adj)
    xcard, xinfeas, xb = evaluate(nodes, adj, sol)
    sol, card = tabu_search(nodes, adj, sol, max_iterations, tabulength)

    rnodelist = []
    bnodelist = []
    for i in range(num_nodes):
        if i in sol:
            rnodelist.append(i)
        else:
            bnodelist.append(i)

    redges = []
    for i in range(len(rnodelist)-1):
        for j in range(i+1,len(rnodelist)):
                redges.append((rnodelist[i],rnodelist[j]))


    nx.draw(G,pos,nodelist=rnodelist,edgelist=redges,node_color='r')
    nx.draw(G,pos,nodelist=bnodelist,edgelist=[],node_color='b')
    plt.savefig("max_clique.png")

例えばHTSヒットの化合物群をMCSベースでネットワークをつくり、最大安定集合問題として解けば、部分構造ベースで非類似度の高い化合物セットを抽出できる(はず)。まぁこういうのはむしろパテントを対象とするべきなのかも。
問題はエッジをどう定義するかなんだけどなぁ(MCSで完璧とも思えないし)。いい方法ないもんかな。