pythonでコマンドを探す

whichみたいなの、というか、外部プログラムを起動したいときに/usr/local/binにあるのか/opt/local/binにあったりするのだけどいちいち意識しなくていいようにスクリプト中で探したい。

例えばgaston

>>> filter(lambda f: os.path.isfile(f),[os.path.join(d,'gaston') for d in os.environ['PATH'].split(':')])
['/opt/local/bin/gaston', '/opt/local/bin/gaston']

最初にヒットしたものだけ

>>> filter(lambda f: os.path.isfile(f),[os.path.join(d,'gaston') for d in os.environ['PATH'].split(':')])[0]
'/opt/local/bin/gaston'

もっとうまいやりかたあるんだと思うんだけどわからんかった。

Box-MullerをPythonで

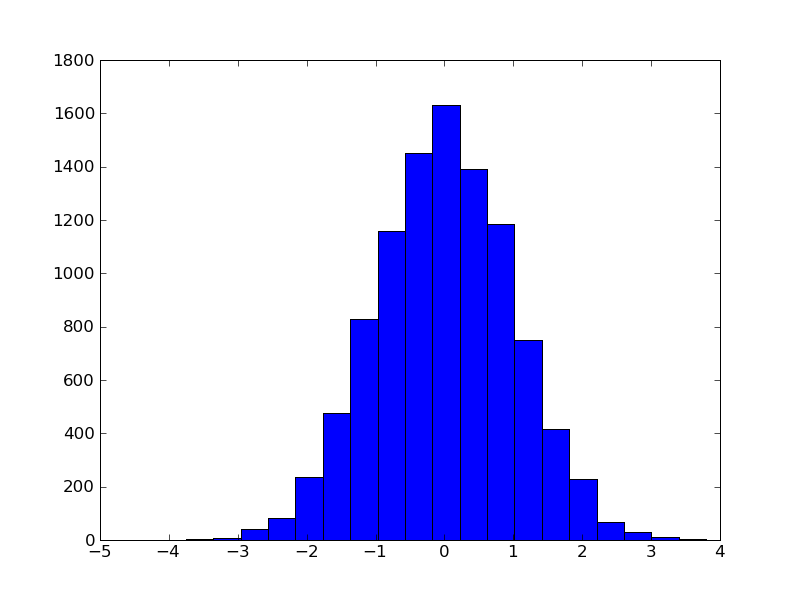
PRML11章。一様乱数から正規乱数を発生させる。

from math import sin,cos,pi,log,sqrt
from random import random

def box_muller():
    z1 = random()
    z2 = random()
    return sqrt(-2*log(z2)) * sin(2*pi*z1)

if __name__ == "__main__":
    from pylab import *
    x = [box_muller() for i in range(10000)]
    hist(x,20)
    savefig("box_muller.png")

box_muller

ProductName パターン認識と機械学習 下 - ベイズ理論による統計的予測
C. M. ビショップ
シュプリンガー・ジャパン株式会社 / ¥ 8,190 ()
在庫あり。

pythonでMCMC

最近、Journal of Pharmaceutical SciencesみたいなDMPKな雑誌を読むようになってきた。その中でScipyとpymcっていうpythonでMCMCができるモジュールを使って解析してた論文を見たので試したくなった。

sudo easy_install-2.6 pymc

でさくっと入って、テストしてみたらなんか色々こけてるようなのだけど、とりあえずサンプル写経

import pymc
import numpy as np
n = 5*np.ones(4,dtype=int)
x = np.array([-.86,-.3,-.05,.73])
alpha = pymc.Normal('alpha',mu=0,tau=.01)
beta = pymc.Normal('beta',mu=0,tau=.01)

@pymc.deterministic
def theta(a=alpha, b=beta):
    """theta = logit^{-1}(a+b)"""
    return pymc.invlogit(a+b*x)

d = pymc.Binomial('d', n=n, p=theta,value=np.array([0.,1.,3.,5.]),observed=True)

これをmymodel.pyって名前で保存しておいて

対話環境から

>>> import mymodel
>>> import pymc
>>> S = pymc.MCMC(mymodel, db='pickle')
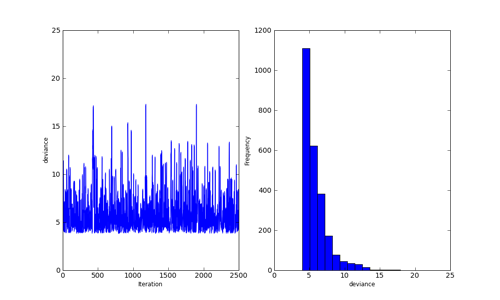
>>> S.sample(iter=10000, burn=5000, thin=2)
>>> pymc.Matplot.plot(S)
>>> pymc.Matplot.savefig("test.png")

mcmc

うーんMCMCわからん。精進せねば。

ProductName パターン認識と機械学習 上 - ベイズ理論による統計的予測
C. M. ビショップ
シュプリンガー・ジャパン株式会社 / ¥ 6,825 ()
在庫あり。

ProductName パターン認識と機械学習 下 - ベイズ理論による統計的予測
C. M. ビショップ
シュプリンガー・ジャパン株式会社 / ¥ 8,190 ()
在庫あり。

macbookのmatplotlibでLookupError

macbookでmatplotlibを使っていたら出たエラー。

LookupError: unknown encoding: X-MAC-JAPANESE

/opt/local/Library/Frameworks/Python.framework/Versions/2.6/lib/python2.6/site-packages/matplotlib/cbook.pyというファイルを書き換えた

def unicode_safe(s):
    if preferredencoding is None: return unicode(s)
    elif preferredencoding == 'X-MAC-JAPANESE': return unicode(s)
    else: return unicode(s, preferredencoding)

Programming the Semantic Web

集合知プログラミングの著者が新しい本を出すみたい。

ProductName Programming the Semantic Web
Toby Segaran
Oreilly & Associates Inc / 3446円 ( 2009-07 )


コードはpythonなのかな。 ちょっと気になる。

matplotlibでgumowski

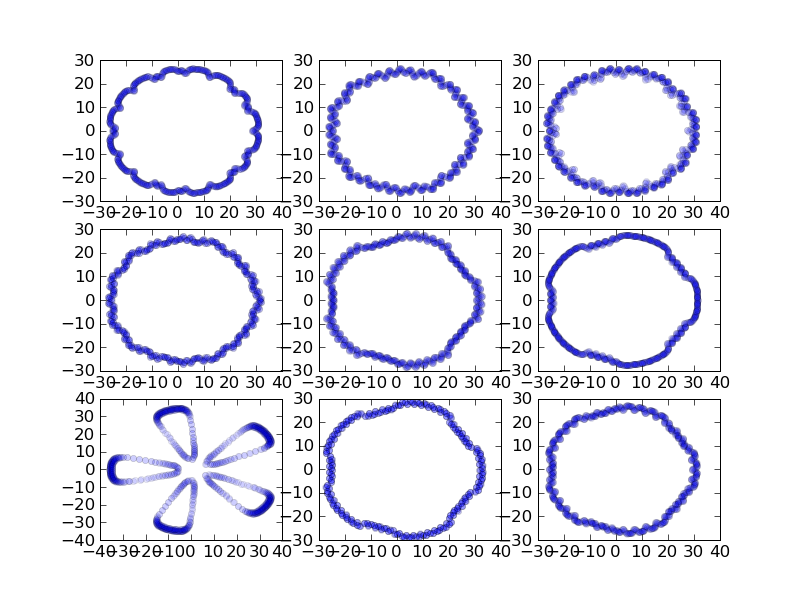
ローレンツのついでにgumowski

gumowski

class Gumowski:
    "Gumowski-Mira Map"
    def __init__(self, x0, y0, a):
        self.x0 = x0; self.y0 = y0
        self.a  = a;

    def f(self,x):
        return self.a*x + 2*(1-self.a)*x**2/(1+x**2)

    def calc(self, n):
        dat = []
        x,y = self.x0, self.y0
        for i in range(n):
            nx = y  + self.f(x)
            ny = -x + self.f(nx)
            dat.append([nx,ny])
            x,y = nx,ny
        return dat

if __name__ == "__main__":
    from pylab import *
    from random import random
    n = 3
    for i in range(n*n):
        p = str(n) + str(n) + str(i+1)
        subplot(p)
        a = random() * 0.1 + 0.3
        gumow = Gumowski(20, 20, a)
        dat = gumow.calc(1000)
        x = [d[0] for d in dat]
        y = [d[1] for d in dat]
        plot(x,y,'bo', alpha=0.1,ms=5)

    savefig("gumow.png")

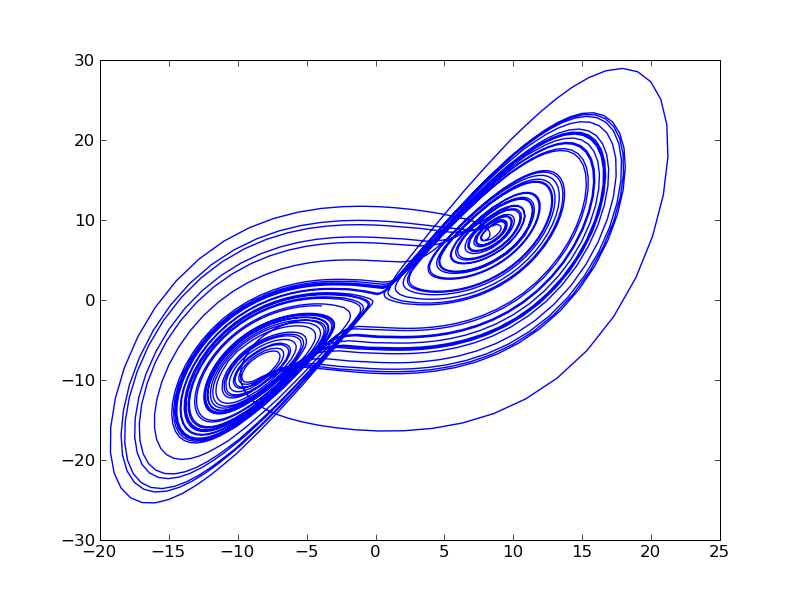
matplotlibでローレンツアトラクタ

どう書くより。

python+matplotlibで。

lorenz

class Lorenz:
    "Lorenz attractor"
    def __init__(self, x0, y0, z0, p, r, b, dt):
        self.x0 = x0; self.y0 = y0; self.z0 = z0
        self.p  = p;  self.r  = r;  self.b  = b
        self.dt = dt

    def calc(self, n):
        dat = []
        x,y,z = self.x0, self.y0, self.z0
        for i in range(n):
            dx = (-1 * self.p * x + self.p * y) * self.dt
            dy = (-x * z + self.r * x - y) * self.dt
            dz = (x * y - self.b * z) * self.dt
            x += dx; y += dy; z += dz
            dat.append([x,y,z])
        return dat

if __name__ == "__main__":
    from pylab import *
    lorenz = Lorenz(1.0, 1.0, 1.0, 10.0, 28.0, 8.0/3.0, 0.01)
    dat = lorenz.calc(5000)
    x = [d[0] for d in dat]
    y = [d[1] for d in dat]
    plot(x,y)
    savefig("lorenz.png")

pythonでdeconvolution

演習本にデコンボリューション法が載っていたのだけど、実装までは載ってなかったので、調べたら、論文が見つかった

ProductName ファーマコキネティクス―演習による理解
杉山 雄一,山下 伸二,加藤 基浩
南山堂 / ¥ 6,300 ()
在庫あり。

GOTOとIFの組み合わせがwhileなのかforなのか悩むとこが幾つかあったが、pythonで書きなおした。結構、fortranっぽさが残っている気もするが。

#!/usr/bin/env python

def calc_eps():
    eps = 1.0
    while eps + 1.0 > 1.0: eps = eps/2.0
    return eps

def sign(a1,a2):
    if a2 >= 0: return abs(a1)
    else:       return -abs(a1)

def deconv(a,div,b,dose):
    n = len(a); m = len(b); l = n + m -1
    eps = calc_eps()
    u = [0.0 for i in range(l)]
    v = [0.0 for i in range(l)]
    gamma = [0.0 for i in range(20)]
    g = [0.0 for i in range(20)]

    a.sort(lambda x,y:cmp(x[1],y[1]))

    for II in range(n-1):
        x1 = a[II][1] * -1
        x2 = a[II+1][1] * -1
        qx1 = 0.0
        qx2 = 0.0

        for i in range(n):
            s1 = 1.0
            s2 = 1.0
            for j in range(n):
                if j != i:
                    s1 = s1*(a[j][1] + x1)
                    s2 = s2*(a[j][1] + x2)
            qx1 = qx1 + a[i][0] * s1
            qx2 = qx2 + a[i][0] * s2

        x3 = x1
        qx3 = qx1
        d = x2 -x1
        e = d

        while(1):

            if abs(qx3) < abs(qx2):
                x1  = x2; x2  = x3; x3  = x1
                qx1 = qx2; qx2 = qx3; qx3 = qx1

            tol = 4.0*eps*abs(x2)
            xm  = 0.5*(x3-x2)

            if abs(xm) <= tol or qx2 == 0.0: break

            if abs(e) >= tol and abs(qx1) > abs(qx2):
                if x1 == x3:
                    s = qx2/qx1; p = 2.0*xm*s; q = 1.0-s
                else:
                    q = qx1/qx3; r = qx2/qx3; s = qx2/qx1
                    p = s*(2.0*xm*q*(q-r) - (x2-x1)*(r-1.0))
                    q = (q-1.0)*(r-1.0)*(s-1.0)

                if p > 0.0: q = -q
                p = abs(p)

                if 2.0*p < 3.0*xm*q - abs(tol*q) and p < abs(0.5*e*q):
                    e = d
                    d = p/q
                else:
                    d = xm
                    e = d
            else:
                d = xm
                e = d

            x1 = x2
            qx1 =qx2
            x2 = x2 + d
            if abs(d) <= tol: x2 = x2 - d + sign(tol,xm)
            qx2 = 0.0
            for i in range(n):
                s2 = 1.0
                for j in range(n):
                    if j != i: s2 = s2*(a[j][1] +x2)
                qx2 = qx2 + a[i][0] * s2
            if qx2*(qx3/abs(qx3)) > 0.0:
                x3 = x1
                qx3 = qx1
                d = x2 - x1
                e = d

        gamma[II] = x2
        s2 = 0.0
        for j in range(n):
            s1 = 0.0
            for k in range(n):
                if k != j:
                    s1 = s1 + 1.0/(gamma[II] + a[k][1])
            s2 = s2 + a[j][0]*s1/(gamma[II] + a[j][1])
        g[II] = 1.0/s2

    ak1 = 0.0
    ak2 = 0.0
    ak3 = 0.0
    for i in range(n):
        ak1 = ak1 + a[i][0];
        ak2 = ak2 + a[i][0]*a[i][1]
        if n > 1 and i != n-1: ak3 = ak3 + g[i]/gamma[i]
    ak1 = 1.0/ak1
    ak2 = ak1*ak1*ak2
    ak3 = ak2 - ak3
    ak4 = 100.0*div/dose
    uz = 0.0

    for i in range(l):
        s = 0.0
        if i > m-1:
            v[i] = -gamma[i-m]
            for j in range(m): 
                s = s + b[j][0]/(gamma[i-m] + b[j][1])
            u[i] = ak4*g[i-m]*s/gamma[i-m]
        else:
            v[i] = b[i][1]
            u[i] = ak4*b[i][0]*(ak1 - ak3/b[i][1])
            if n != 1:
                for j in range(n-1):
                    s = s + g[j]/(gamma[j]*(gamma[j] + b[i][1]))
                u[i] = u[i] - ak4*b[i][0]*s
        uz = uz - u[i]

    return uz,u,v

if __name__ =='__main__':
    print "=== Data set 1 ==="
    a     = [[1.0427,5.0526],[0.97617,0.97567]]
    div   = 1.0
    b     = [[-0.80547,3.6373],[0.80547,0.83033]]
    dose  = 0.6

    print deconv(a,div,b,dose)

    print "=== Data set 2 ==="
    a     = [[1.3377,3.1851],[0.52381,0.61065]]
    div   = 1.0
    b     = [[-2.2637,2.0800],[2.2637,1.2513]]
    dose  = 0.6

    print deconv(a,div,b,dose)

    print "=== Data set 3 ==="
    a     = [[1.0308,5.9131],[1.0487,1.0262]]
    div   = 1.0
    b     = [[-1.6103,3.3563],[1.6103,1.3917]]
    dose  = 0.6

    print deconv(a,div,b,dose)

    print "=== Data set 4 ==="
    a     = [[1.3377,3.1851],[0.52381,0.61065]]
    div   = 1.0
    b     = [[-5.5440,2.2488],[5.5440,1.7521]]
    dose  = 0.6

    print deconv(a,div,b,dose)

Table.1 のテスト計算を実行。論文のデータセット4のa2はタイポでしょう。

=== Data set 1 ===
(103.38116460095375, 
[99.756988719460651, -23.218031509886707, -179.92012181052769], 
[3.6373000000000002, 0.83033000000000001, 2.9469592648362699])
=== Data set 2 ===
(94.012343334076377, 
[212.39909284817011, 2395.320119577972, -2701.7315557602187], 
[2.0800000000000001, 1.2513000000000001, 1.3350740721242431])
=== Data set 3 ===
(94.362883301636657, 
[-1704.7606134762168, 73.013373899587776, 1537.3843562749923], 
[3.3563000000000001, 1.3916999999999999, 3.4906828227939406])
=== Data set 4 ===
(91.15932635164495, 
[370.51731307178676, -1111.1884882257646, 649.51184880233291], 
[2.2488000000000001, 1.7521, 1.3350740721242431])

pythonでfloat

整数で割る際にfloatの数値が欲しいときに2.0と書いてたけど0は必要ないらしい

>>> 1/2
0
>>> 1/2.
0.5
>>> 1./2
0.5

でもちょっと読みにくいので、今まで通りきちんと書くかな。

グラフ分割問題をsimulated annealingで

グラフつくるとことは禁断探索法と一緒。

ProductName メタヒューリスティクスの数理
久保 幹雄,J. P. ペドロソ
共立出版 / ¥ 3,675 ()
在庫あり。

def evaluate(nodes, adj, sol, alpha):
    s = [0 for i in nodes]
    d = [0 for i in nodes]
    bal = 0
    for i in nodes:
        if sol[i] == 0:
            bal += 1
        else:
            bal -= 1
        for j in adj[i]:
            if sol[j] == sol[i]:
                s[i] += 1
            else:
                s[i] -= 1
    cost = 0
    for i in nodes: cost += d[i]
    cost /= 2
    cost += alpha*abs(bal)
    return cost, bal, s, d

def find_move_rnd(n, sol, alpha, s, d, bal):
    istar = random.randint(0,n-1)
    part = sol[istar]
    if part == 0 and bal > 0 or part == 1 and bal < 0:
        penalty = -2*alpha
    else:
        penalty = 2*alpha
    delta = s[istar] - d[istar] + penalty
    return istar, delta

def update_move(adj, sol, s, d, bal, istar):
    part = sol[istar]
    sol[istar] = 1-part
    s[istar], d[istar] = d[istar], s[istar]
    for j in adj[istar]:
        if sol[j] == part:
            s[j] -= 1
            d[j] += 1
        else:
            s[j] += 1
            d[j] -= 1
    if part == 0:
        bal -= 1
    else:
        bal += 1
    return bal

def estimate_temperature(n, sol, s, d, bal, initprob):
    ntrials = 10 * len(sol)
    nsucc = 0
    deltaZ = 0.0
    for i in range(0,ntrials):
        part = random.randint(0,1)
        istar, delta = find_move_rnd(n, sol, alpha, s, d, bal)
        if delta > 0:
            nsucc += 1
            deltaZ += delta
    if nsucc != 0:
        deltaZ /= nsucc
    T = -deltaZ/math.log(initprob)
    return T

def metropolis(T, delta):
    if delta <= 0 or random.random() < math.exp(-(delta)/T):
        return True
    else:
        return False

def annealing(nodes, adj, sol, initprob, tempfactor, sizefactor, cutoff, freezelim, minpercent, alpha):
    n = len(nodes)
    z,bal,s,d = evaluate(nodes, adj, sol, alpha)
    if bal == 0:
        solstar, zstar = list(sol), z
    T = estimate_temperature(n, sol, s, d, bal, initprob)
    nfrozen = 0
    part = 0
    while nfrozen < freezelim:
        changes, trials = 0,0
        while trials < n*sizefactor and changes < n*cutoff:
            trials += 1
            istar, delta = find_move_rnd(n, sol, alpha, s, d, bal)
            if metropolis(T, delta):
                changes += 1
                bal = update_move(adj, sol, s, d, bal, istar)
                z += delta
                if bal == 0:
                    if z < zstar and part == 0:
                        solstar, zstar = list(sol), z
                        nfrozen = 0
        T *= tempfactor
        if float(changes)/trials < minpercent:
            nfrozen += 1
    return solstar, zstar


if __name__ == "__main__":
    import networkx as nx
    import matplotlib.pyplot as plt

    num_nodes = 50
    nodes, adj = rnd_graph_fast(num_nodes,0.3)
    G=nx.Graph()
    for i in range(num_nodes):
        G.add_node(i)
    for i in range(num_nodes-1):
        for j in adj[i]:
            if i < j:
                G.add_edge(i,j)
    pos=nx.spring_layout(G)

    initprob = .4    # initial acceptance probability
    sizefactor = 16  # for det. # tentatives at each temp.
    tempfactor = .95 # cooling ratio
    freezelim = 5    # max number of iterations with less that minpercent acceptances
    minpercent = .02 # fraction of accepted moves for being not frozen
    alpha = .05      # imballance factor
    N = len(nodes)   # neighborhood size
    L = N*sizefactor # number of tentatives at current temperature 

    sol = construct(nodes)
    z,bal,s,d = evaluate(nodes, adj, sol, alpha)

    sol,z = annealing(nodes, adj, sol, initprob, tempfactor, N, L, freezelim, minpercent, alpha)
    zp,bal,sp,dp = evaluate(nodes, adj, sol, alpha)

    rnodelist = []
    bnodelist = []
    for i in range(len(sol)):
        if sol[i] == 1:
            rnodelist.append(i)
        else:
            bnodelist.append(i)
    nx.draw(G,pos,nodelist=rnodelist,node_color='r')
    nx.draw(G,pos,nodelist=bnodelist,node_color='b')
    plt.savefig("path.png")
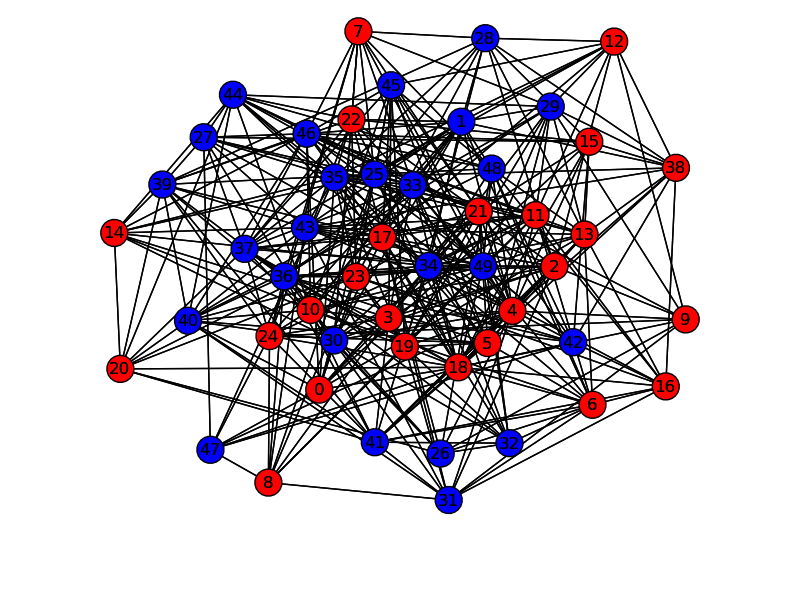
graph