
01 07 2009 Python matplotlib Tweet
どう書くより。
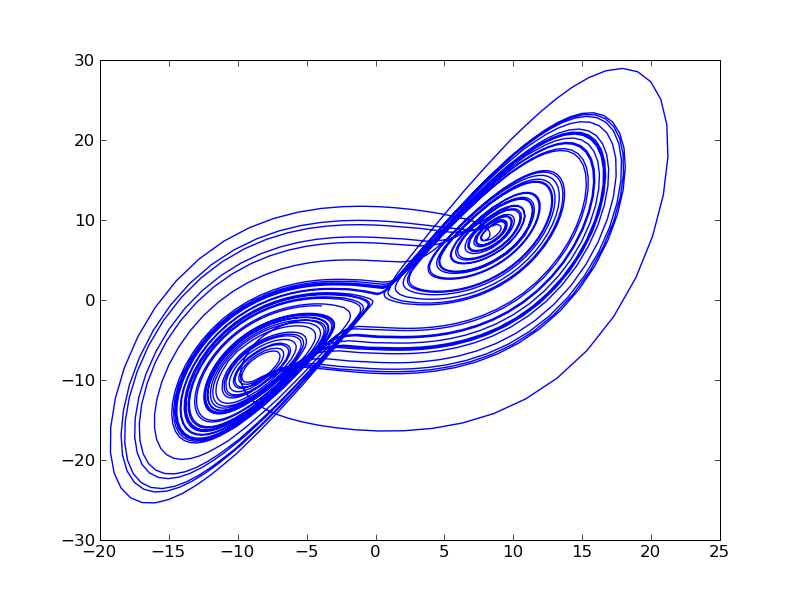
python+matplotlibで。
class Lorenz:
    "Lorenz attractor"
    def __init__(self, x0, y0, z0, p, r, b, dt):
        self.x0 = x0; self.y0 = y0; self.z0 = z0
        self.p  = p;  self.r  = r;  self.b  = b
        self.dt = dt

    def calc(self, n):
        dat = []
        x,y,z = self.x0, self.y0, self.z0
        for i in range(n):
            dx = (-1 * self.p * x + self.p * y) * self.dt
            dy = (-x * z + self.r * x - y) * self.dt
            dz = (x * y - self.b * z) * self.dt
            x += dx; y += dy; z += dz
            dat.append([x,y,z])
        return dat

if __name__ == "__main__":
    from pylab import *
    lorenz = Lorenz(1.0, 1.0, 1.0, 10.0, 28.0, 8.0/3.0, 0.01)
    dat = lorenz.calc(5000)
    x = [d[0] for d in dat]
    y = [d[1] for d in dat]
    plot(x,y)
    savefig("lorenz.png")