
12012010 Python matplotlib
matplotlibがメインなのかな?目次だけだとよくわからん。
 Beginning Python Visualization: Crafting Visual Transformation Scripts (Books for Professionals by Professionals)
Shai Vaingast
Apress / ¥ 4,123 ()
在庫あり。
ビジュアライジング・データ読んどけば良い気もするが。
12012010 Python matplotlib
matplotlibがメインなのかな?目次だけだとよくわからん。
Beginning Python Visualization: Crafting Visual Transformation Scripts (Books for Professionals by Professionals)ビジュアライジング・データ読んどけば良い気もするが。
26112009 Python matplotlib
Pythonの描画ライブラリであるmatplotlibの本が出てた。
 Matplotlib for Python Developers: Build Remarkable Publication Quality Plots the Easy Way
欲しいのう
15082009 Python matplotlib PRML
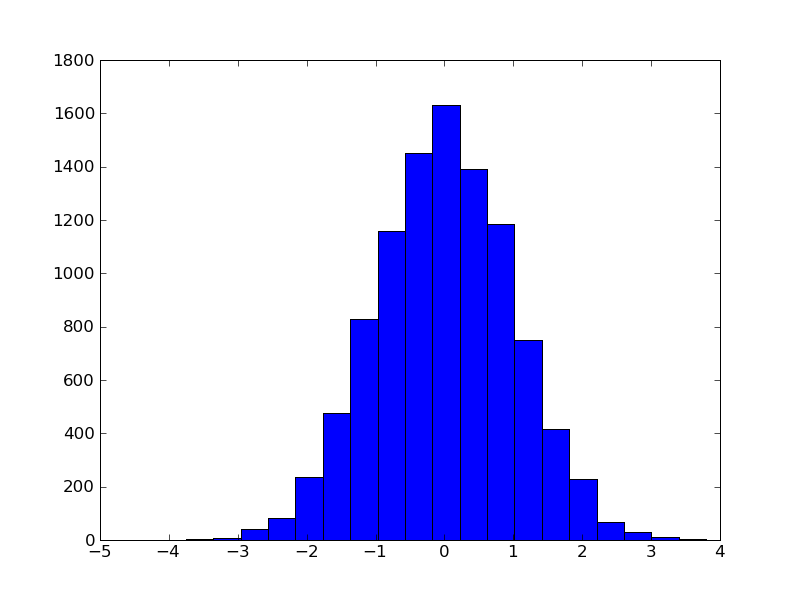
PRML11章。一様乱数から正規乱数を発生させる。
from math import sin,cos,pi,log,sqrt
from random import random

def box_muller():
    z1 = random()
    z2 = random()
    return sqrt(-2*log(z2)) * sin(2*pi*z1)

if __name__ == "__main__":
    from pylab import *
    x = [box_muller() for i in range(10000)]
    hist(x,20)
    savefig("box_muller.png")
11072009 Python macbook matplotlib
macbookでmatplotlibを使っていたら出たエラー。
LookupError: unknown encoding: X-MAC-JAPANESE
/opt/local/Library/Frameworks/Python.framework/Versions/2.6/lib/python2.6/site-packages/matplotlib/cbook.pyというファイルを書き換えた
def unicode_safe(s):
    if preferredencoding is None: return unicode(s)
    elif preferredencoding == 'X-MAC-JAPANESE': return unicode(s)
    else: return unicode(s, preferredencoding)
02072009 Python matplotlib
ローレンツのついでにgumowski
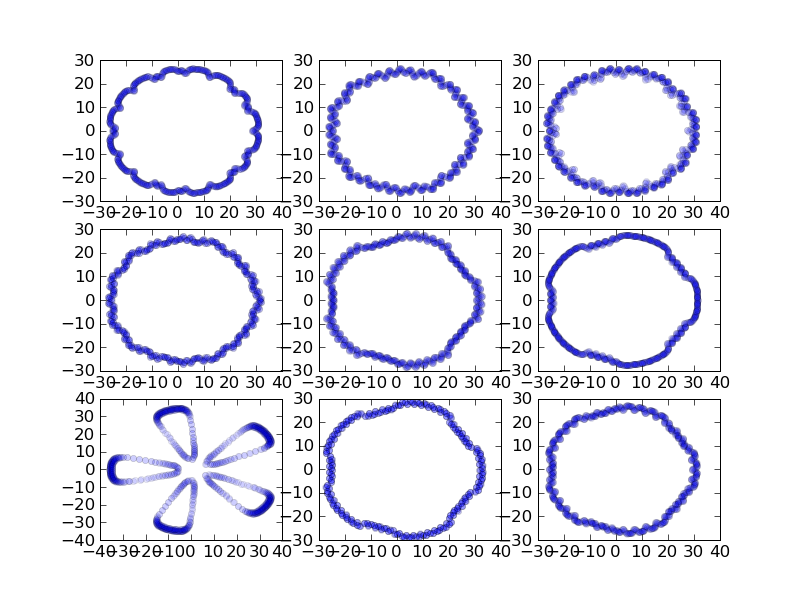
class Gumowski:
    "Gumowski-Mira Map"
    def __init__(self, x0, y0, a):
        self.x0 = x0; self.y0 = y0
        self.a  = a;

    def f(self,x):
        return self.a*x + 2*(1-self.a)*x**2/(1+x**2)

    def calc(self, n):
        dat = []
        x,y = self.x0, self.y0
        for i in range(n):
            nx = y  + self.f(x)
            ny = -x + self.f(nx)
            dat.append([nx,ny])
            x,y = nx,ny
        return dat

if __name__ == "__main__":
    from pylab import *
    from random import random
    n = 3
    for i in range(n*n):
        p = str(n) + str(n) + str(i+1)
        subplot(p)
        a = random() * 0.1 + 0.3
        gumow = Gumowski(20, 20, a)
        dat = gumow.calc(1000)
        x = [d[0] for d in dat]
        y = [d[1] for d in dat]
        plot(x,y,'bo', alpha=0.1,ms=5)

    savefig("gumow.png")
01072009 Python matplotlib
どう書くより。
python+matplotlibで。
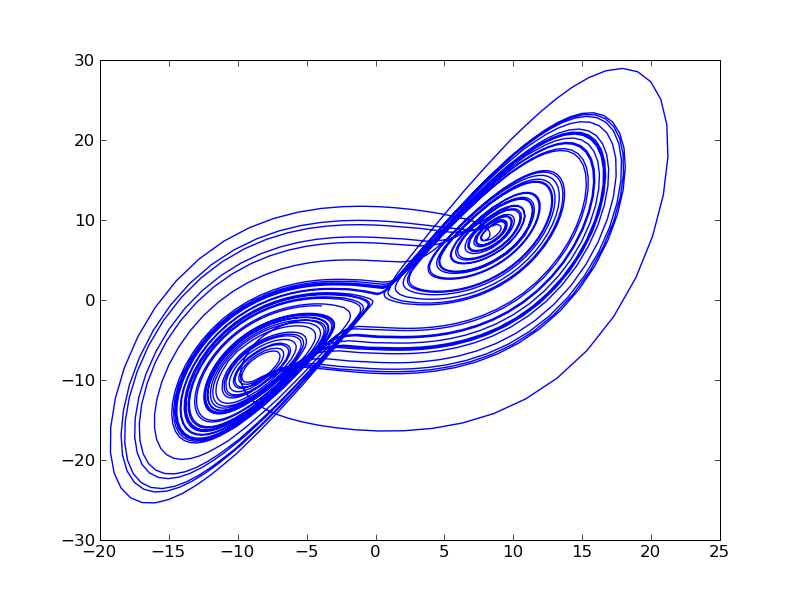
class Lorenz:
    "Lorenz attractor"
    def __init__(self, x0, y0, z0, p, r, b, dt):
        self.x0 = x0; self.y0 = y0; self.z0 = z0
        self.p  = p;  self.r  = r;  self.b  = b
        self.dt = dt

    def calc(self, n):
        dat = []
        x,y,z = self.x0, self.y0, self.z0
        for i in range(n):
            dx = (-1 * self.p * x + self.p * y) * self.dt
            dy = (-x * z + self.r * x - y) * self.dt
            dz = (x * y - self.b * z) * self.dt
            x += dx; y += dy; z += dz
            dat.append([x,y,z])
        return dat

if __name__ == "__main__":
    from pylab import *
    lorenz = Lorenz(1.0, 1.0, 1.0, 10.0, 28.0, 8.0/3.0, 0.01)
    dat = lorenz.calc(5000)
    x = [d[0] for d in dat]
    y = [d[1] for d in dat]
    plot(x,y)
    savefig("lorenz.png")
 ビジュアライジング・データ ―Processingによる情報視覚化手法
 パターン認識と機械学習 下 - ベイズ理論による統計的予測