
12 01 2010 chemoinformatics Python matplotlib Tweet
五角形にしたかったのでrule of fiveにPolar Surface Areaを加えておいた。
#!/usr/bin/env python
from matplotlib.projections.polar import PolarAxes
from matplotlib.projections import register_projection
from pylab import *

class RadarAxes(PolarAxes):
    """Class for creating a radar chart (a.k.a. a spider or star chart)
    http://en.wikipedia.org/wiki/Radar_chart
    """
    name = 'radar'
    # use 1 line segment to connect specified points
    RESOLUTION = 1

    def draw_frame(self, x0, y0, r):
        verts = [(r*cos(t) + x0, r*sin(t) + y0) for t in theta]
        return Polygon(verts, closed=True)

    def set_varlabels(self, labels):
        self.set_thetagrids(theta * 180/pi, labels)

    def get_axes_patch(self):
        x0, y0 = (0.5, 0.5)
        r = 0.5
        return self.draw_frame(x0, y0, r)

if __name__ == '__main__':

    register_projection(RadarAxes)
    N = 5

    theta = 2*pi * linspace(0, 1, N+1)[:-1]
    theta += pi/2
    labels = ['HBA', 'HBD', 'cLogP', 'MWT', 'PSA']
    rule_of_five = [10, 5, 5, 500, 140]
    desc = [12, 3, 3.6, 532, 160]
    desc_rate = [100*desc[i]/float(v) for (i,v) in enumerate(rule_of_five)]

    ax = subplot(111, projection='radar')

    ax.fill(theta, [100]*N)
    ax.fill(theta, desc_rate)

    for patch in ax.patches:
        patch.set_alpha(0.5)

    ax.set_varlabels(labels)
    rgrids((20, 40, 60, 80, 100))

    grid(True)
    show()
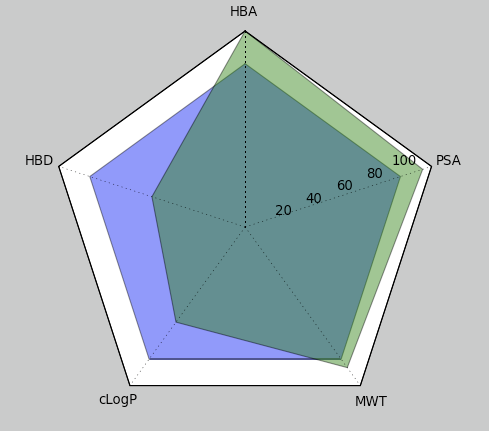
rule of fiveのようにある範囲内に収まっていること(超えるとリスク)というような指標を表すのにレーダーチャートは適しているんだろうか。つまり充足している事を示すような面積の表現はいいのかなぁ。あと、レンジが負になったりするのでそれもどうかと思う。
再考の余地はあるな。
TODO:多変量がある決まったレンジ内に収まっているかどうかを視覚的に捉えやすい表現手段を探す。