12 01 2010 Python matplotlib Tweet
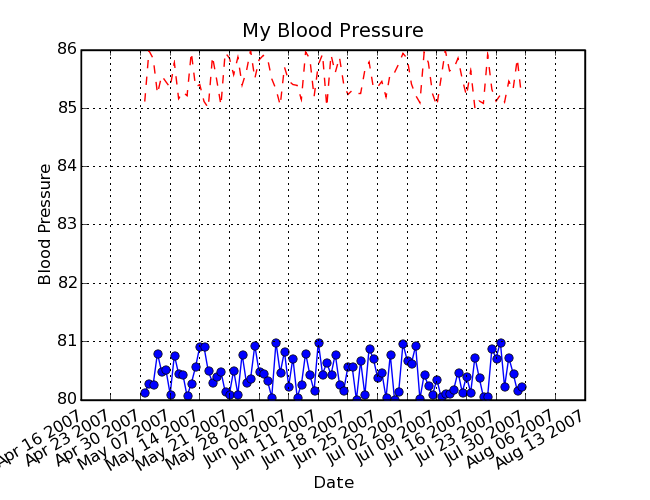
pythonのグラフ描画ライブラリであるmatplotlibで日付ごとにプロットするサンプル。
from pylab import *
from matplotlib.dates import MONDAY, WeekdayLocator
import datetime

start_date = datetime.date(2007, 5, 1)
end_date   = datetime.date.today()
delta = datetime.timedelta(days=1)

mondays   = WeekdayLocator(MONDAY)

dates = drange(start_date,end_date,delta)

s = rand(len(dates)) + 85
t = rand(len(dates)) + 80

fig = figure()
ax = fig.add_subplot(111)
ax.plot_date(dates, s, 'r--')
ax.plot_date(dates, t, 'bo-')

ax.xaxis.set_major_locator(mondays)
ax.autoscale_view()
ax.grid(True)
fig.autofmt_xdate()

title('My Blood Pressure')
xlabel('Date')
ylabel('Blood Pressure')

fig.savefig('datetest')

