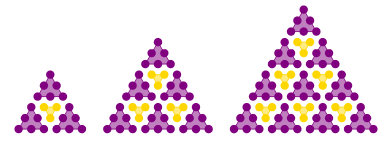
diagramsを使ってみた。
{-# LANGUAGE NoMonomorphismRestriction #-}
import Diagrams.Prelude
import Diagrams.Backend.SVG.CmdLine
import Data.Colour

tri c n = dots <> (strokeT edges # lc c # lw 0.2 # fcA (c `withOpacity` 0.5))
  where rows = map (hcat' with { sep = 1 })
             . zipWith replicate [n,n-1..1]
             . repeat
             $ dot c
        dots = decorateTrail (rotateBy (1/6) edge) rows
        edge = fromOffsets . replicate (n-1) $ unitX # scale 3
        edges = close (edge <> rotateBy (1/3) edge <> rotateBy (2/3) edge)

dot c = unitCircle # lw 0 # fc c

rowSpc = height (rotateBy (1/6) $ strutY 1 :: D R2)
row k n s c = hcat' with {sep = 1 + 3*s} (replicate k (tri c n))
law4 k n c1 c2 = vcat' with {sep = rowSpc} (map tRow [1..k])
  where tRow k = (row k n 0 c1 # centerX # alignT)
                 <>
                 (row (k-1) (n-1) 1 c2 # reflectY # centerX # alignT)
exampleRow f = hcat' with {sep = 4} . map (alignB . f)

law4Dia = exampleRow law4' [2..4]
  where law4' k = law4 k 3 purple gold

example = pad 1.1 $ law4Dia # centerXY

main = defaultMain example
これだけで下のような図が作成できる