
04 01 2011 javascript graph Tweet
JGPのsyntax diagramみたいなのをGraphvizで描きたくて色々頑張ってみたんだけど、僕には無理だった。
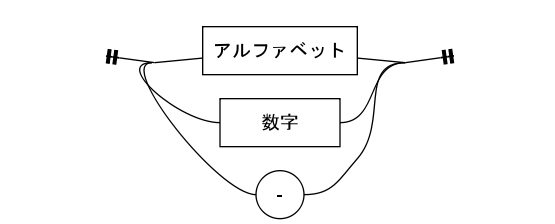
graph Heawood {
      node [label="\N", fontname=Arial, width="0.50000", height="0.500000", color=black];
      edge [color=black];
      graph [rankdir = LR];

      subgraph cluster1 {
               color=none

               Start [style=invis];
               L1 [style=invis, width=0.0, shape=point];
               Alpha [shape=box, label="アルファベット"];
               L2 [style=invis, width=0.0, shape=point];
           End [style=invis];

           Start -- L1 [arrowtail=teetee];
               L1    -- Alpha;
               Alpha -- L2;
               L2    -- End [arrowhead=teetee];

      }

      Digit [shape=box, label="   数字   "];
      Hif [shape=circle, label="-"];

      L1    -- Digit [tailport=w,headport=w];
      L1    -- Hif [tailport=w,headport=w];
      Digit -- L2 [tailport=e,headport=w];
      Hif   -- L2 [tailport=e,headport=w];
}
 JavaScript: The Good Parts ―「良いパーツ」によるベストプラクティス
参考