
fglを使えばよい。
import Data.Graph.Inductive
import Data.Graph.Inductive.Example
import Data.Graph.Inductive.Graphviz

m486 :: NodeMap String
m486 = fromGraph clr486

t1 :: Gr String ()
t1 = insMapEdge m486 ("shirt", "watch", ()) clr486

t2 :: Gr String ()
t2 = insMapEdge m486 ("watch", "pants", ()) t1

main = do putStrLn $ graphviz t2 "test" (0,0) (0,0) Portrait
これはDOT言語で出力される。
digraph test {
margin = "0"
page = "0.0,0.0"
size = "0.0,0.0"
rotate = "0"
ratio = "fill"
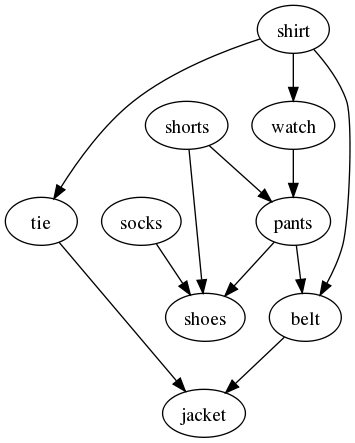
1 [label = "shorts"]
2 [label = "socks"]
3 [label = "watch"]
4 [label = "pants"]
5 [label = "shoes"]
6 [label = "shirt"]
7 [label = "belt"]
8 [label = "tie"]
9 [label = "jacket"]
1 -> 4
1 -> 5
2 -> 5
3 -> 4
4 -> 7
4 -> 5
6 -> 3
6 -> 8
6 -> 7
7 -> 9
8 -> 9
}
pngで出力したいときにはdotに渡す。
$ ./gvtest | dot -Tpng > gvtest.png
参考